I wrote this code which tries to make colorful patterns on a square grid such that for a given color, all squares of that color can reach all other squares of that color without stepping on any other color.**
First I made the grid:
library(igraph)

create_lattice_graph <- function(width, height) {
    coords <- expand.grid(x = 1:width, y = 1:height)
    n_nodes <- nrow(coords)

    horizontal_edges <- cbind(1:(n_nodes-1), 2:n_nodes)
    horizontal_edges <- horizontal_edges[horizontal_edges[,1] %% width != 0, ]

    vertical_edges <- cbind(1:(n_nodes-width), (width+1):n_nodes)

    edges <- rbind(horizontal_edges, vertical_edges)
    g <- make_graph(edges = t(edges), n = n_nodes, directed = FALSE)

    return(list(graph = g, layout = as.matrix(coords)))
}
Then, I wrote a function which checks to see if a color choice is valid:
is_valid_move <- function(position, player, territories, g) {
    neighbors <- neighbors(g, position)
    has_same_territory_neighbor <- any(territories[neighbors] == player)
    return(has_same_territory_neighbor)
}
From here, the color is set (a set of source nodes are chosen):
generate_territories <- function(width, height, source_nodes) {
    lattice <- create_lattice_graph(width, height)
    g <- lattice$graph
    n_nodes <- vcount(g)
    n_players <- length(source_nodes)

    territories <- rep(NA, n_nodes)

    for(i in 1:n_players) {
        territories[source_nodes[i]] <- i
    }

    while(any(is.na(territories))) {
        empty_positions <- which(is.na(territories))
        valid_moves <- list()

        for(pos in empty_positions) {
            neighbors <- neighbors(g, pos)
            neighbor_territories <- unique(territories[neighbors])
            neighbor_territories <- neighbor_territories[!is.na(neighbor_territories)]

            if(length(neighbor_territories) > 0) {
                for(territory in neighbor_territories) {
                    if(is_valid_move(pos, territory, territories, g)) {
                        valid_moves[[length(valid_moves) + 1]] <- list(
                            position = pos,
                            territory = territory
                        )
                    }
                }
            }
        }

        if(length(valid_moves) == 0) break

        selected_move <- sample(length(valid_moves), 1)
        position <- valid_moves[[selected_move]]$position
        territory <- valid_moves[[selected_move]]$territory
        territories[position] <- territory
    }

    return(territories)
}
Finally, the results are visualziaed:
convert_to_color_matrix <- function(territories, width, height) {
    color_matrix <- matrix(".", nrow = height, ncol = width)
    color_map <- c("R", "B", "G", "Y", "P")

    for(i in 1:length(territories)) {
        row <- ceiling(i/width)
        col <- ((i-1) %% width) + 1
        color_matrix[row, col] <- color_map[territories[i]]
    }

    return(color_matrix)
}

plot_color_matrix <- function(color_matrix, source_nodes = NULL) {
    plot(NULL, xlim = c(0, ncol(color_matrix)), ylim = c(0, nrow(color_matrix)),
         xlab = "", ylab = "", axes = FALSE, asp = 1)

    color_map <- c(
        "R" = "#FF6B6B",  # Red
        "B" = "#4DABF7",  # Blue
        "G" = "#69DB7C",  # Green
        "Y" = "#FFD93D",  # Yellow
        "P" = "#DA77F2",  # Purple
        "." = "#F8F9FA"   # Empty
    )

    for(i in 1:nrow(color_matrix)) {
        for(j in 1:ncol(color_matrix)) {
            linear_idx <- (i-1)*ncol(color_matrix) + j
            is_source <- linear_idx %in% source_nodes

            rect(j-1, nrow(color_matrix)-i, j, nrow(color_matrix)-i+1,
                 col = color_map[color_matrix[i,j]],
                 border = if(is_source) "black" else "gray90",
                 lwd = if(is_source) 2 else 0.5)

            # Add node numbers
            text(j-0.5, nrow(color_matrix)-i+0.5, linear_idx,
                 col = "black", cex = 0.4)
        }
    }
}
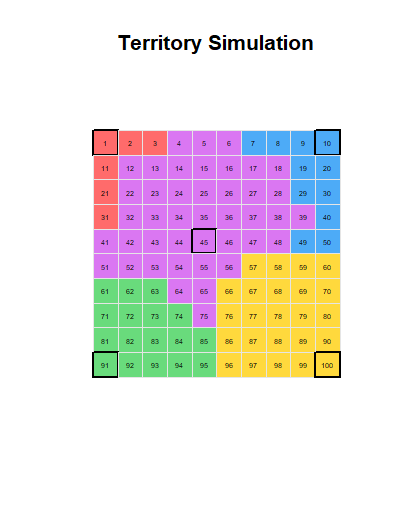
The full simulation looks like this:
width <- 10
height <- 10
source_nodes <- c(1, 10, 91, 100, 45)
territories <- generate_territories(width, height, source_nodes)
color_matrix <- convert_to_color_matrix(territories, width, height)
plot_color_matrix(color_matrix, source_nodes)
title("Territory Simulation")
When I ran multiple simulations, I notice that this color connectivity rule is sometimes violated:
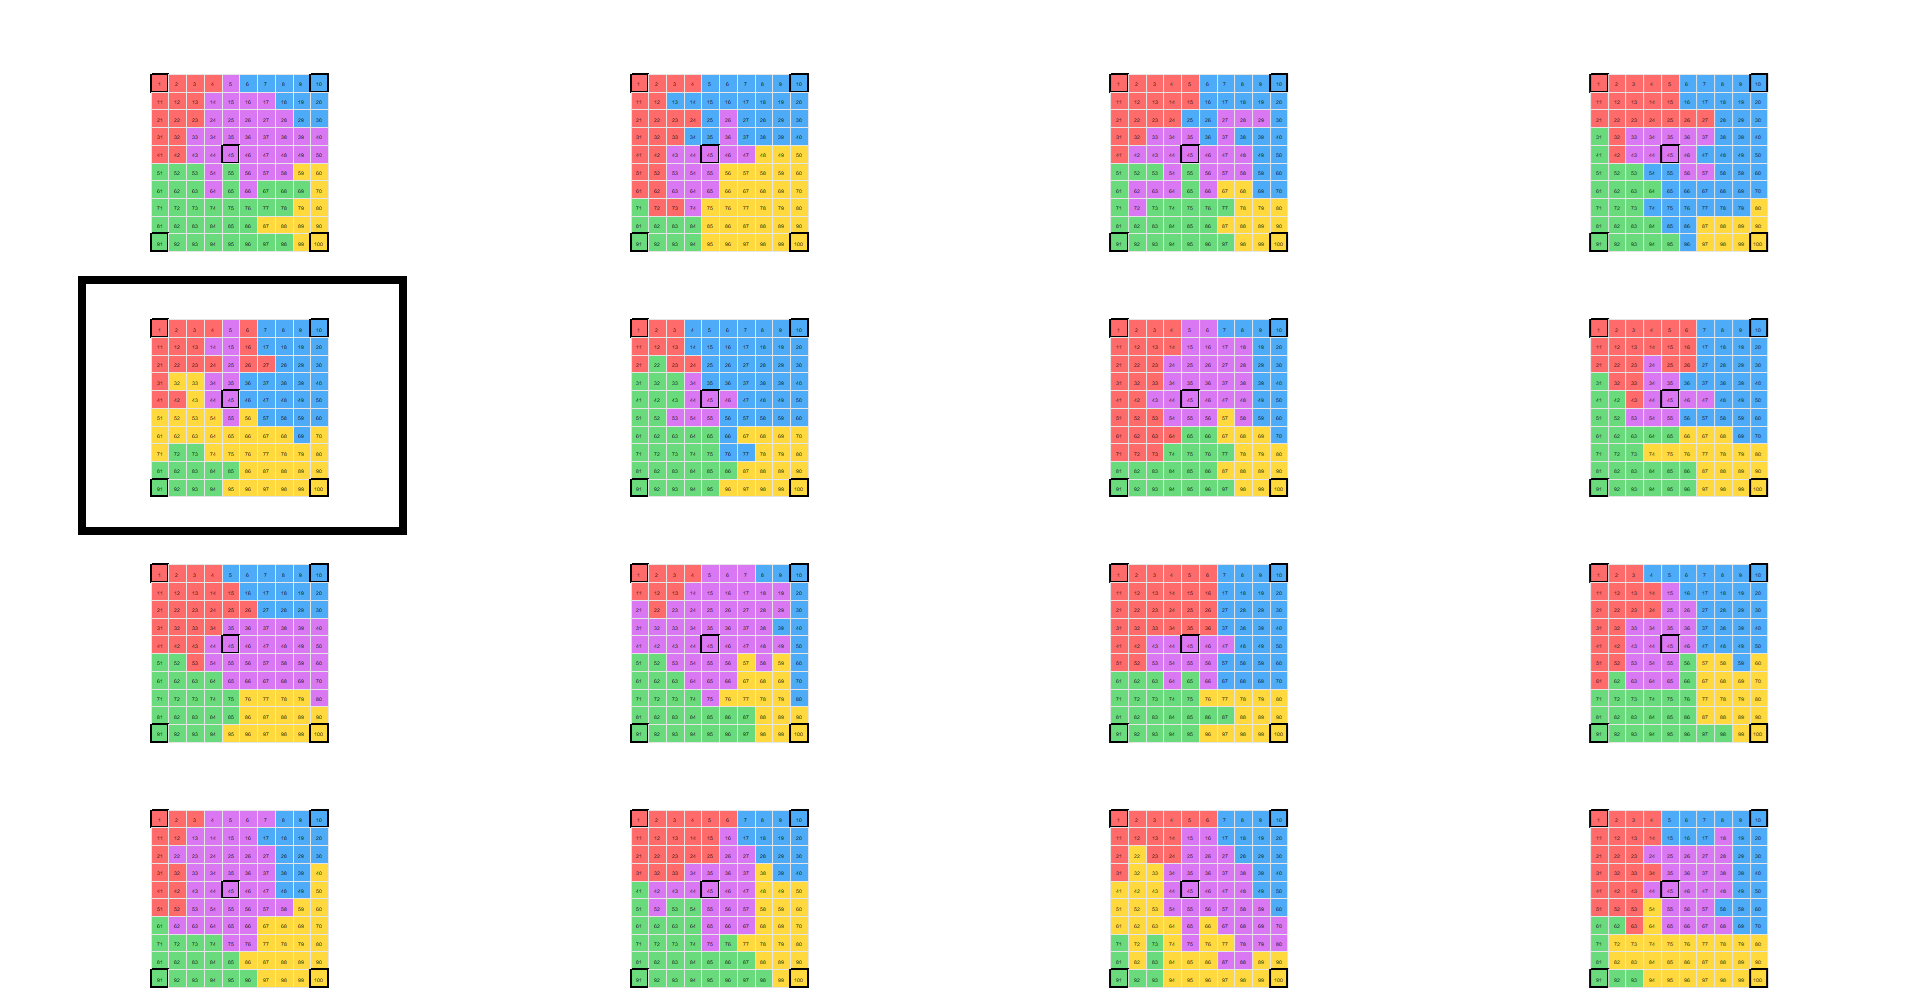
For example, in the above I can see that there is a block of red, followed by purple, followed by red ... such that some of the red is locked off from the rest of the red.
Is there a way I can fix this problem?
Thanks
 asked Sep 30 '25 10:09
The code below doesn't give the full randomness in terms of splitting (due to the use of bfs), but I tried to use rmultinom to compensate for the drawback.
Note that, the code takes your create_lattice_graph as a part of it:
f <- function(width, height, source_nodes, rndSeed = 0) {
  set.seed(rndSeed)
  # create graph
  s <- create_lattice_graph(width, height)
  g <- s$graph
  lo <- s$layout

  # define number of sub graphs
  nrsubg <- length(source_nodes)
  g <- g %>%
    set_vertex_attr("name", value = seq.int(vcount(.)))

  # iteratively partition the graph from given source node
  repeat {
    gg <- g
    valid <- TRUE
    vlst <- setNames(vector("list", nrsubg), seq.int(nrsubg))
    szsubg <- rmultinom(1, vcount(g) - nrsubg, runif(nrsubg)) + 1
    for (i in seq_along(szsubg)) {
      u <- names(bfs(gg, as.character(source_nodes[i]), callback = \(graph, data, extra) data["rank"] == szsubg[i])$order)
      if (is_connected(induced_subgraph(gg, u)) & sum(source_nodes %in% u) == 1) {
        gg <- induced_subgraph(gg, V(gg)[!names(V(gg)) %in% u])
        vlst[[i]] <- u
      } else {
        valid <- FALSE
        break
      }
    }
    if (vcount(gg) == 0) break
  }

  # visualize the partitions
  g %>%
    set_vertex_attr("color",
      value = with(stack(vlst), ind[match(names(V(.)), values)])
    ) %>%
    plot(
      layout = lo,
      vertex.label = V(.)$name,
      vertex.label.color = ifelse(names(V(.)) %in% source_nodes, "red", "black"),
      vertex.size = 15,
      edge.color = "gray",
      main = sprintf("territory simulation (random seed = %i)", rndSeed)
    )
}
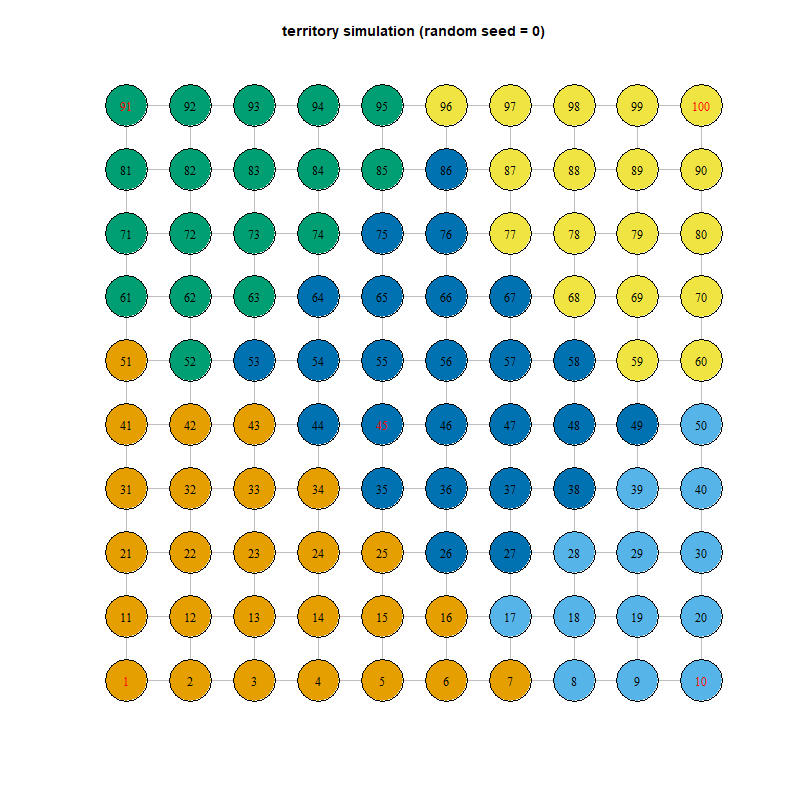
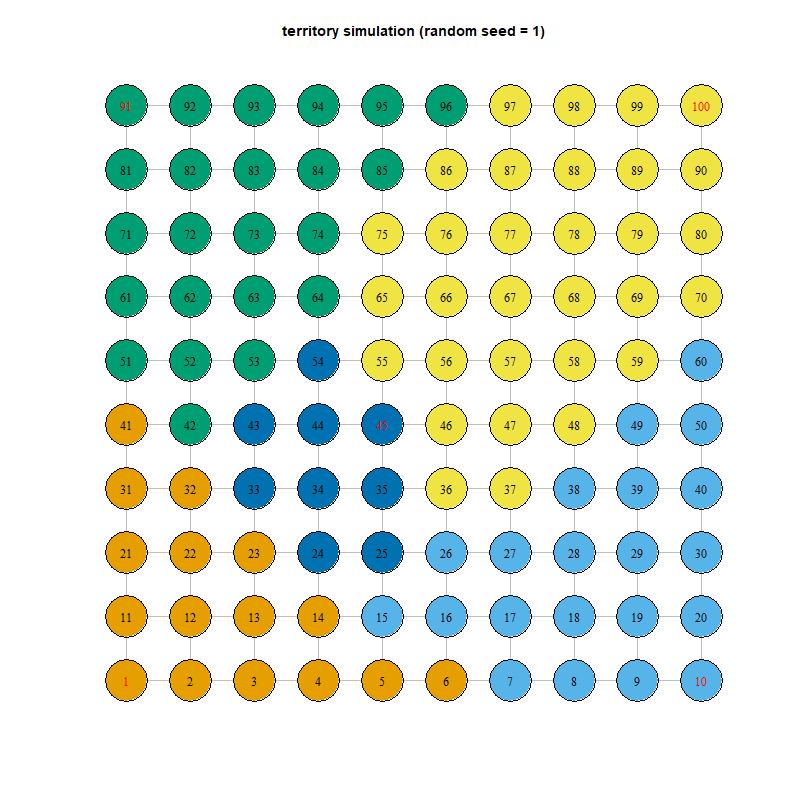
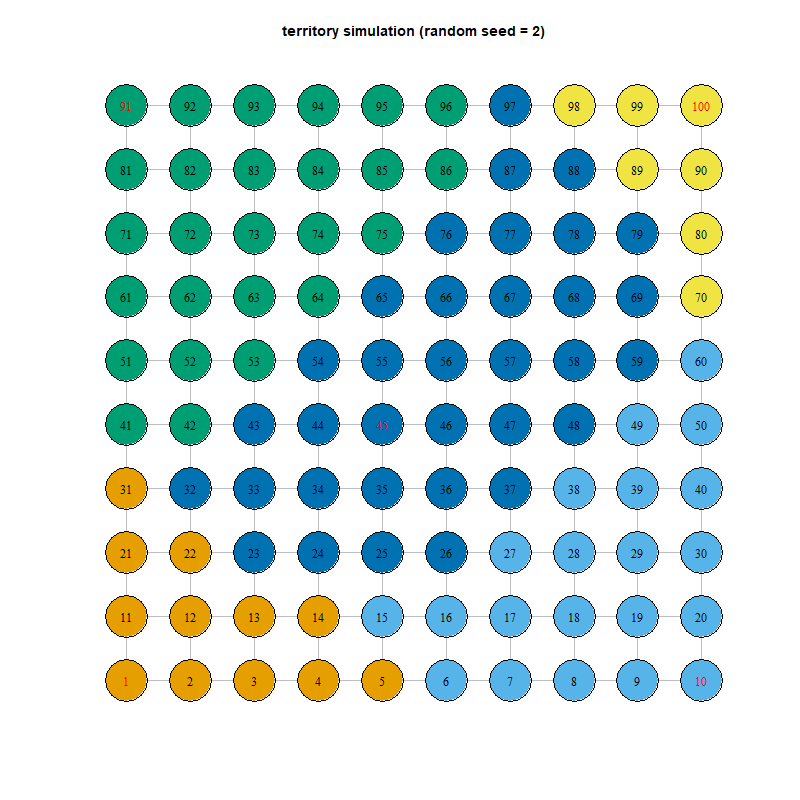
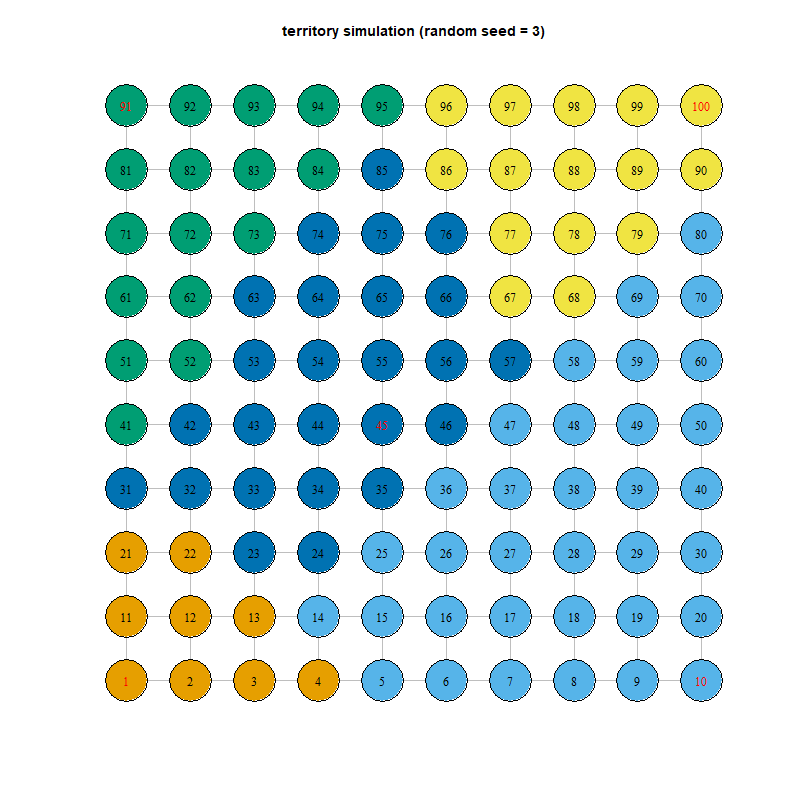
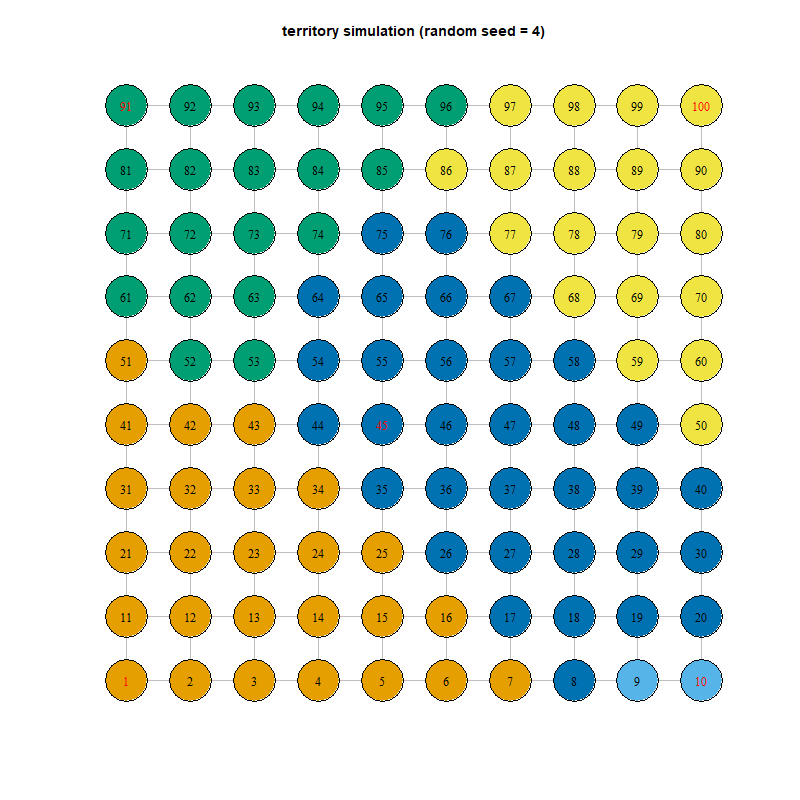
Given input argument as below
width <- 10
height <- 10
source_nodes <- c(1, 10, 91, 100, 45)
we will obtain splits with random seeds 0 to 4 respectively
If you love us? You can donate to us via Paypal or buy me a coffee so we can maintain and grow! Thank you!
Donate Us With
