I wrote the following code, I want that when I move the slider, the text plotted on the figure to change accordingly, which means removing the previous text, and plotting the new values read from a text list, and being able to do this back and forth. However, after one movement on the slider, the text(s) overlay and not remove. I need help about this issue, how to change the plotted text while moving the slider? Notice that the colors of the plotted squares are changing according their values with no problem.
from matplotlib import pyplot
from matplotlib.widgets import Slider
import matplotlib.pyplot as plt
import numpy as np

a = np.random.randint(10, size = 4)
b = np.random.randint(10, size = 4)
c = np.random.randint(10, size = 4)
d = np.random.randint(10, size = 4)

grid = ((a,b),(c,d))
grid = np.array(grid)

fig = plt.figure(figsize=(7,5))
ax = fig.add_subplot(111)
subplots_adjust(left=0.15, bottom=0.25)

words = ['Sample1', 'Sample2']

data_start = 0.5
dataSlider_ax  = fig.add_axes([0.15, 0.1, 0.7, 0.05])
dataSlider = Slider(dataSlider_ax, 'value', 0, 1, valinit=data_start)

def update(val):
    ref = int(dataSlider.val)
    print (ref)
    ax.imshow(grid[ref], interpolation ='none', aspect = 'auto')
    for (j,i),label in np.ndenumerate(grid[ref]):
        text = ax.text(i,j,words[ref])
#        I uncomment the following line, in case I wanted to plot the values of the arrays
#        text = ax.text(i,j,grid[ref][j][i])

dataSlider.on_changed(update)
pyplot.show()
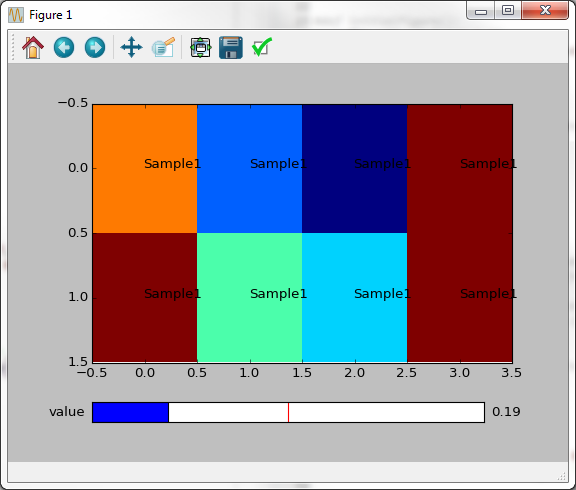
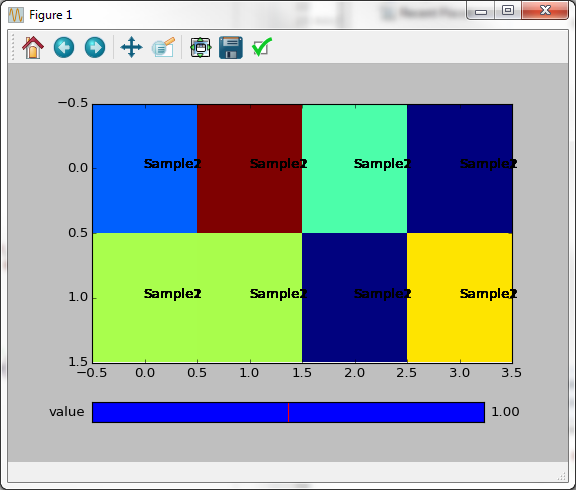
Use the set_text method on the object returned by text. Likewise, although the image seems to change fine, you are in fact allocating more and more objects all the time and drawing them on top of each other, and you could use set_data to change the image with less memory allocation. Here's a modified example (I'm multiplying the slider value by 2 in order to see any changes when moving the slider):
from matplotlib import pyplot
from matplotlib.widgets import Slider
import matplotlib.pyplot as plt
import numpy as np

a, b, c, d = [np.random.randint(10, size = 4) for _ in range(4)]
grid = ((a,b),(c,d))
grid = np.array(grid)

fig = plt.figure(figsize=(7,5))
ax = fig.add_subplot(111)
plt.subplots_adjust(left=0.15, bottom=0.25)

words = ['Sample1', 'Sample2']

data_start = 0.5
dataSlider_ax  = fig.add_axes([0.15, 0.1, 0.7, 0.05])
dataSlider = Slider(dataSlider_ax, 'value', 0, 1, valinit=data_start)

image = ax.imshow(grid[0], interpolation='none', aspect='auto')
texts = [[ax.text(i,j,words[0])
          for i in range(grid.shape[2])]
         for j in range(grid.shape[1])]

def update(val):
    global image, texts
    ref = int(dataSlider.val * 2)
    print (ref)
    image.set_data(grid[ref])
    for (j,i),label in np.ndenumerate(grid[ref]):
        texts[j][i].set_text(words[ref])
    print(ax.get_children())  # if this list keeps getting longer, you are leaking objects

dataSlider.on_changed(update)
pyplot.show()
If you love us? You can donate to us via Paypal or buy me a coffee so we can maintain and grow! Thank you!
Donate Us With

