I'm generating a stacked bar graph in Matplotlib with errorbars. Unfortunately, some of the tiers are relatively small and the data diverse, so that the errorbars of several tiers can overlap, making them hard or impossible to read.
Example:
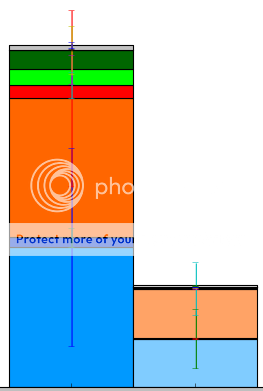
Is there a way to set the location for each errorbar (i.e. move it along the x-axis), so the overlapping lines are displayed next to instead of on top of each other?
Thanks to tcaswell's comment, I figured it out: The trick is to not include the errorbars in the bar (via the yerr kword), but plot the bar and errorbar separately. This way you can specify the x and y location of the errorbar.
It also helps clearness to plot the errorbars upwards only using yerr= numpy.vstack([[0]*len(std), std]).
Incorporated into the plotting function from here my code looks like this:
for j in range(set_count):
    tmp_accum = numpy.zeros(len(props[0]))
    for k in range(len(props)):
        ax1.bar(ind + j*b_width, props[k][set_label==j], width=b_width, color=color_sets[j][k], bottom=tmp_accum[set_label==j],label=labels[k])
        ax1.errorbar(ind + j*b_width +(1+k)*0.01, props[k][set_label==j]+tmp_accum[set_label==j],yerr= numpy.vstack([[0]*1, std_devs[k][j]]), ecolor="black",elinewidth =3)
        tmp_accum += props[k]
If you love us? You can donate to us via Paypal or buy me a coffee so we can maintain and grow! Thank you!
Donate Us With
