I'm trying to understand how scikit-image's local_binary_pattern() function works. Let's take the simplest setup: input is a grayscale image, radius = 1, n_points = 4, method = "uniform". How does this output an image?
From what I understand, there's a sliding 3x3 window that passes through the whole image. At each location, take the value of the center pixel and compare it to the values of the pixels above, left, below and right of the center pixel. Each may be less than or greater than the value of the center pixel. That's 2^4 = 16 possibilities. Make a histogram of how often each of the 16 possibilities occurs.
The problem is that this is a histogram, not an image. So why does local binary pattern return an image?
I asked someone about this, and he said maybe they don't make the histogram, and instead record the information about which pixels are greater than or less than the center as a length 4 binary vector. This can then be converted into an integer between 0 and 15 in the obvious way. Do this for all the pixels, and the result can then be interpreted as a greyscale image, with 16 levels. Ok, but this conversion necessarily depends on the order in which the neighboring pixels (above, left, below, right) are taken. So why does the documentation say that the "uniform" setting is rotation invariant?
Q:
"why does the documentation say that the "uniform" setting is rotation invariant?"
the rotation-independence part is well explained here :
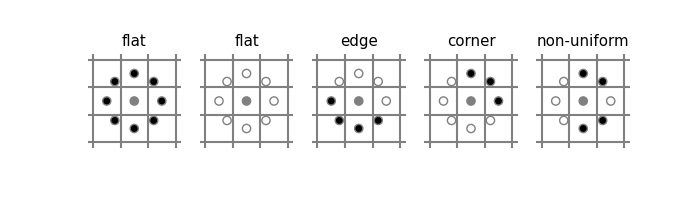
Groups of continuous black or white pixels are considered “uniform” patterns that can be interpreted as corners or edges. If pixels switch back-and-forth between black and white pixels, the pattern is considered “non-uniform”.
In use, the rotational independence is warranted "grid-wise", as addition ( algebraic sum of values ) is commutative, that is order independent, as explained here :
"(...)
The rule for finding LBP of an image is as follows:
1) Set a pixel value as center pixel.
2) Collect its neighbourhood pixels (Here I am taking a 3 x 3 matrix so; total number of neighbourhood pixel is 8)
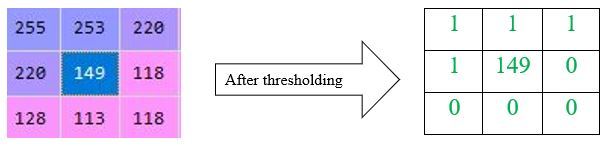
3) Threshold it’s neighbourhood pixel value to 1 if its value is greater than or equal to centre pixel value otherwise threshold it to 0.
4) After thresholding, collect all threshold values from neighbourhood either clockwise or anti-clockwise. The collection will give you an 8-digit binary code. Convert the binary code into decimal.
5) Replace the center pixel value with resulted decimal and do the same process for all pixel values present in image.
(...)"
Visually, for each pixel we do this :
Take the sum ( performed clockwise TLBR here ;o) ) :
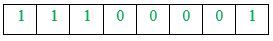
  1 x 2^7
+ 1 x 2^6
+ 1 x 2^5
+ 0 x 2^4
+ 0 x 2^3
+ 0 x 2^2
+ 0 x 2^1
+ 1 x 2^0
= 128 + 64 + 32 + 0 + 0 + 0 + 0 + 1
= 225
Finally, the sum gets assigned to the pixel, for which it was calculated by LBP-method. This is why the result is a piecewise-(pixel-wise)-computed transformed image :
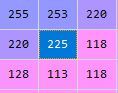
This, per-pixel produced transformation is the answer to your original question :
Q :
"How does Local Binary Pattern return an image?"
Histograms are just helpers to represent relative frequencies of occurences of per-pixel computed LBP-sums, which thus carry some visually percievable representation of which 3x3-LBP-sums-("patterns") are less or more frequent in the whole original picture, thus helping to assume about texture/pattern (di)similarities, when algorithmically detecting (some phenomenon-under-study) or comparing visual scenes
If you love us? You can donate to us via Paypal or buy me a coffee so we can maintain and grow! Thank you!
Donate Us With

