I was recently doing some statistics based on openstreetmaps. When I used overpass to export the German Autobahnen and geopandas to calculate their length, I found that the lengths do not match the official figures.
The total length calculated should be roughly the double of the length given by the German ministry of infrastructure (BMVI), since both directions of the highways are mapped separately. The overpass query already excludes connecting ramps, exits, (...).
Comparing the longest dozen of them, most were obviously overestimated, because the figures were 50/60% higher than the official ones. (See image)

Whats the reason for that difference?
Overpass-code:
[out:json][timeout:100];
{{geocodeArea:Deutschland}}->.searchArea;
way["highway"="motorway"]["ref"="A 7"](area.searchArea);
out body;
>;
out skel qt;
Code (python)
import geopandas as gpd
import pandas as pd

autobahn = "A7"
columns = ["ref", "length_m"]

df_total = pd.DataFrame(columns=columns)

gdf = gpd.read_file(f"https://fliessbaden.de/wp-content/uploads/A7.geojson")
gdf = gdf.to_crs(epsg=3857)

gdf["length_m"] = gdf.geometry.length

total_m = gdf['length_m'].sum()
total_km = total_m / 1000
print(autobahn + ": " + str(round(total_km, 2)) + " km")
 asked Oct 24 '25 14:10
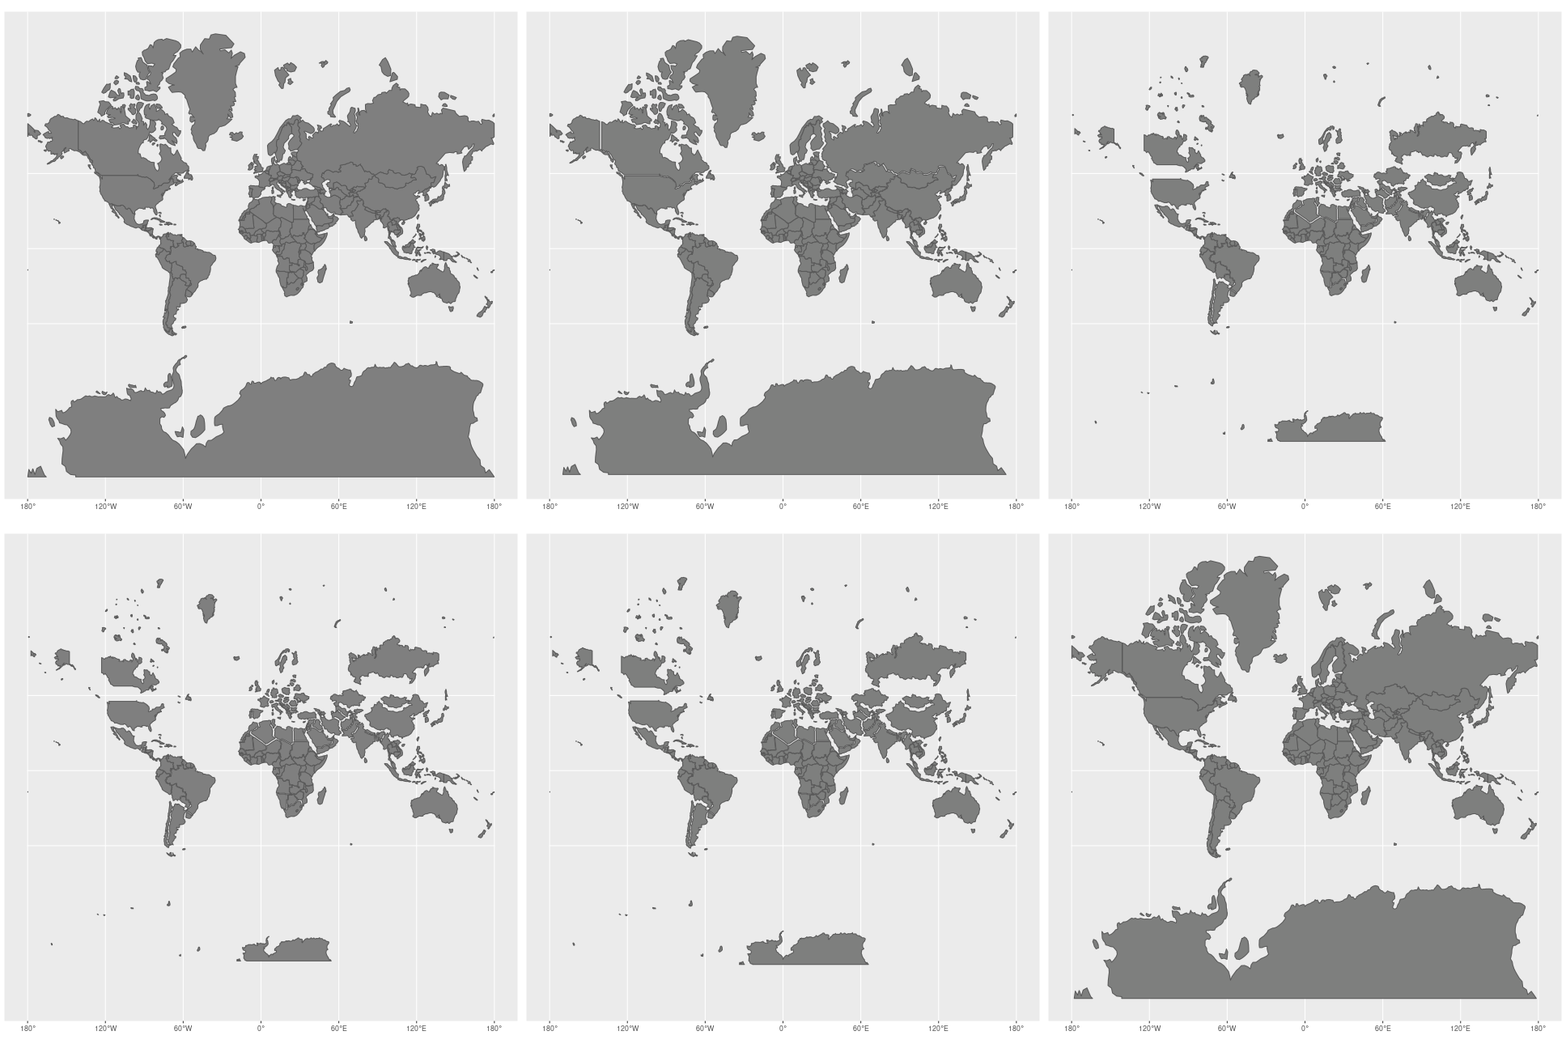
You are projecting the data to EPSG:3857, which is a global Mercator projection. Mercator projects the globe to a flat map, retaining angles (useful for marine navigation), but distorting areas and distances more and more the farther they are from the equator. Hence, distances not being correct is to be expected.
The images below illustrate the distortions. The first illustration shows that a distance distortion of +60% is to be expected at ~50° north...
If you want to calculate distances in Europe, you can par example use the equidistant ESRI:102031 projection, which seerms consistent with what you are seeing.
EDIT: I added some more possible projections to the script as well as they were suggested by other users...
import geopandas as gpd
import pandas as pd

autobahn = "A7"
columns = ["ref", "length_m"]
expected_distance = 1924
print(f"{autobahn}, expected distance: {expected_distance} km")

df_total = pd.DataFrame(columns=columns)

gdf = gpd.read_file(f"https://fliessbaden.de/wp-content/uploads/A7.geojson")

for crs in ["ESRI:102031", "EPSG:25833", "EPSG:32632", "EPSG:4839"]:
    gdf = gdf.to_crs(crs)

    gdf["length_m"] = gdf.geometry.length

    total_m = gdf['length_m'].sum()
    total_km = total_m / 1000
    print(f"{autobahn}, {crs} ({gdf.crs.name}): {str(round(total_km, 2))} km")
Output:
A7, expected distance: 1924 km
A7, ESRI:102031 (Europe_Equidistant_Conic): 1929.86 km
A7, EPSG:25833 (ETRS89 / UTM zone 33N): 1938.05 km
A7, EPSG:32632 (WGS 84 / UTM zone 32N): 1935.2 km
A7, EPSG:4839 (ETRS89 / LCC Germany (N-E)): 1935.31 km
 Source
The "small" sizes are the actual sizes on the globe, the incorrect "large" ones are due to the distortions of the Mercater projection.
 By Jakub Nowosad - Own work, CC BY-SA 4.0
 answered Oct 27 '25 04:10
Just convert your Mercator coordinate system to a Lambert Projection.
import geopandas as gpd

gdf = gpd.read_file(f"https://fliessbaden.de/wp-content/uploads/A7.geojson")

gdf2 = gdf.to_crs("4839")

gdf2.length.sum() / 1000  # 1935.3071447893633
If you love us? You can donate to us via Paypal or buy me a coffee so we can maintain and grow! Thank you!
Donate Us With